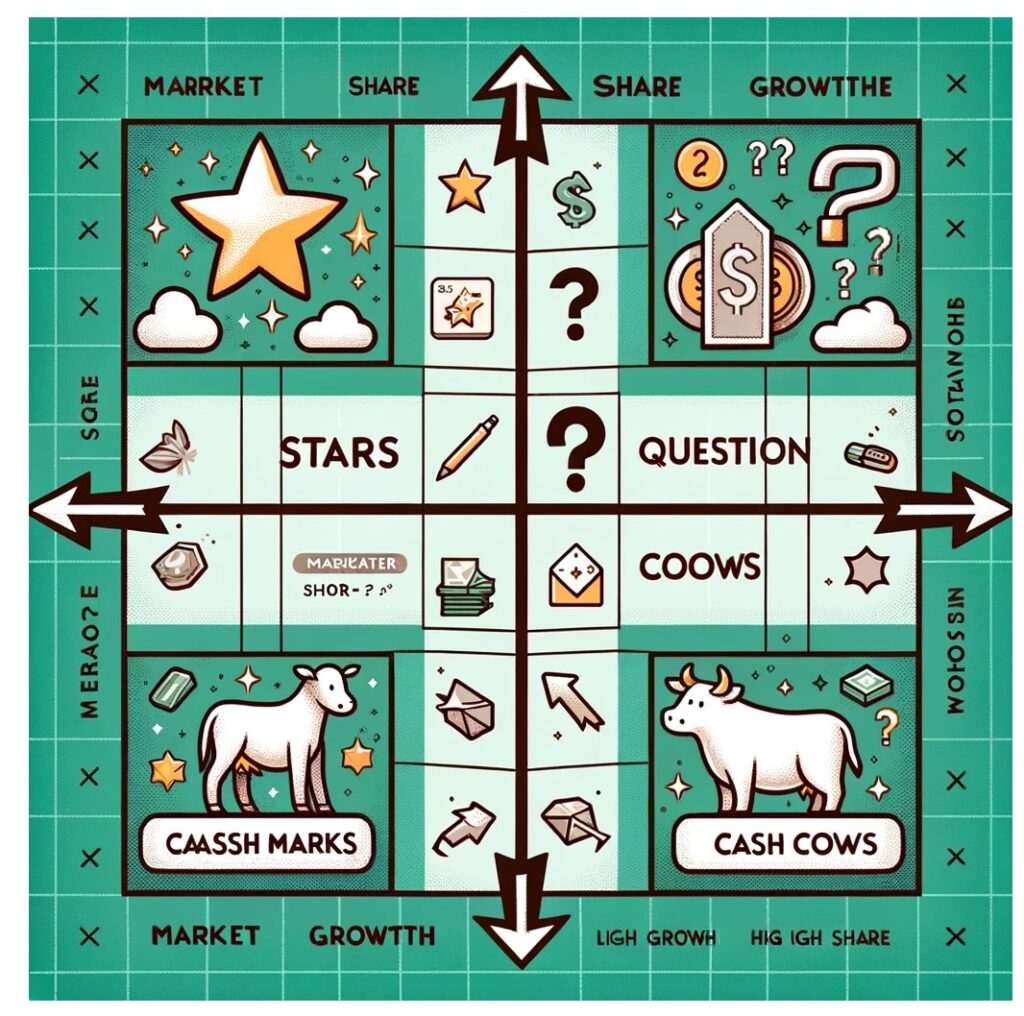
The BCG matrix, also known as the Growth-Share matrix, is a strategic planning tool developed by the Boston Consulting Group in the 1970s. It is used by businesses to evaluate the relative performance of their product portfolio based on market growth and market share. The matrix categorizes products into four quadrants:
Stars: High market growth, high market share. These are leading products in fast-growing markets that require significant investment to maintain their position but have the potential for substantial returns.
Question Marks: High market growth, low market share. These products are in growing markets but have a low market share. They require substantial investment to increase market share, and management must decide whether to invest or divest.
Cash Cows: Low market growth, high market share. These are mature, successful products with little need for investment. They generate more cash than is required to maintain their market share and fund the company’s growth products.
Dogs: Low market growth, low market share. Products in this quadrant generate just enough cash to maintain themselves but do not have much potential for growth. Often, the strategy is to divest these products.
Strategy Implications
The BCG matrix helps companies in allocating resources and strategizing for each product or business unit. The aim is to have a balanced portfolio of Stars (for future growth), Cash Cows (for current profits), and a minimal number of Question Marks and Dogs. The matrix encourages organizations to:
Invest in Stars to maintain their leading position as long as the market grows.
Evaluate Question Marks carefully, investing in those with the potential to become Stars and divesting others.
Harvest Cash Cows to support investment in Stars and promising Question Marks.
Divest Dogs, as they are unlikely to generate significant profits or growth.
Similar Tools and Methodologies
Other strategic planning tools and methodologies that offer alternative or complementary insights include:
Ansoff Matrix: Focuses on growth strategies by varying product offerings and market presence.
Porter’s Five Forces: Analyzes industry competitiveness and the potential profitability of a market.
PESTEL Analysis: Examines external factors (Political, Economic, Social, Technological, Environmental, and Legal) that can affect an organization’s success.
SWOT Analysis: Identifies Strengths, Weaknesses, Opportunities, and Threats related to business competition or project planning.
McKinsey 7S Framework: Analyzes internal organizational effectiveness by examining seven key elements (strategy, structure, systems, shared values, skills, style, and staff).
These tools can be used in conjunction with the BCG matrix to provide a more comprehensive view of a company’s strategic position and potential directions for growth and optimization.