The GE/McKinsey Matrix is a strategic tool used in business to help companies decide where to invest their resources for the best returns. Developed in the 1970s by McKinsey & Company for General Electric, the matrix is a more complex version of the BCG (Boston Consulting Group) Matrix. It is designed to evaluate business portfolios and prioritize investments among different business units.
Overview of the GE/McKinsey Matrix
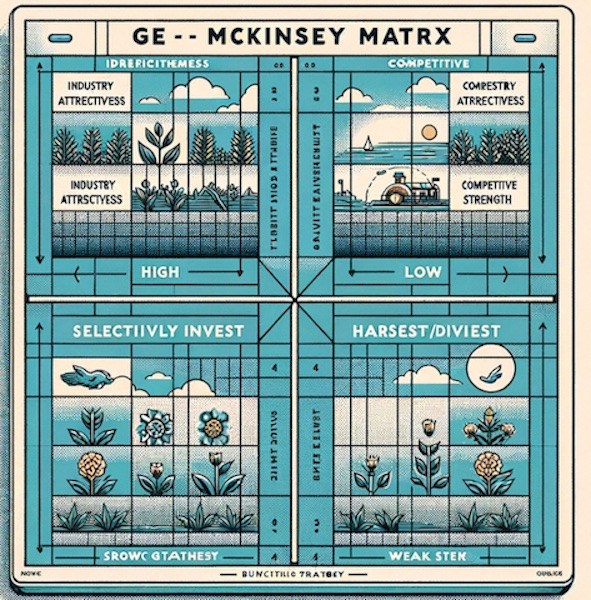
The matrix is a 3×3 grid that assesses business units on two dimensions:
- Industry Attractiveness: This includes factors such as market growth, market size, and profitability. It is plotted on the vertical axis, with higher positions indicating more attractive markets.
- Competitive Strength: This includes factors such as market share, brand strength, and product quality. It is plotted on the horizontal axis, with positions further to the right indicating stronger competitive positions.
Each business unit is placed within this matrix, allowing companies to categorize them into one of three zones:
- Invest: Units in attractive industries with strong competitive positions are considered for further investment.
- Selectively Invest: Units with medium industry attractiveness or competitive strength are selected for investment on a case-by-case basis.
- Harvest/Divest: Units in unattractive industries or with weak competitive positions are considered for divestiture or for strategies to maximize short-term returns.
Application
The GE/McKinsey Matrix is particularly useful for large, diversified corporations that need to allocate resources efficiently among different business units. It helps in making strategic decisions about whether to invest, develop, or divest in particular segments of the business.
Similar Tools and Methodologies
BCG Matrix: Similar to the GE/McKinsey Matrix, the BCG Matrix categorizes business units into four categories (Stars, Cash Cows, Question Marks, and Dogs) based on market growth and market share. It is simpler and more straightforward but does not account for as many variables as the GE/McKinsey Matrix.
Ansoff Matrix: Focuses on growth strategies by considering new vs. existing products and markets. It helps businesses decide on strategies like market penetration, market development, product development, and diversification.
Porter’s Five Forces: While not a portfolio analysis tool like the GE/McKinsey Matrix, Porter’s Five Forces is crucial for analyzing industry attractiveness by evaluating competitive intensity, potential entrants, substitute products, bargaining power of suppliers, and bargaining power of customers.
PESTEL Analysis: Offers a broader view of the external environment by analyzing political, economic, social, technological, environmental, and legal factors. This can complement the GE/McKinsey Matrix by providing insights into industry attractiveness.
Implementing the GE/McKinsey Matrix requires a thorough understanding of the market and internal capabilities, making it a powerful tool for strategic decision-making in complex business landscapes.